Breakdown
The reason you want to categorize all of your transactions is so you can see where your money go, and where they come from, broken down by category.
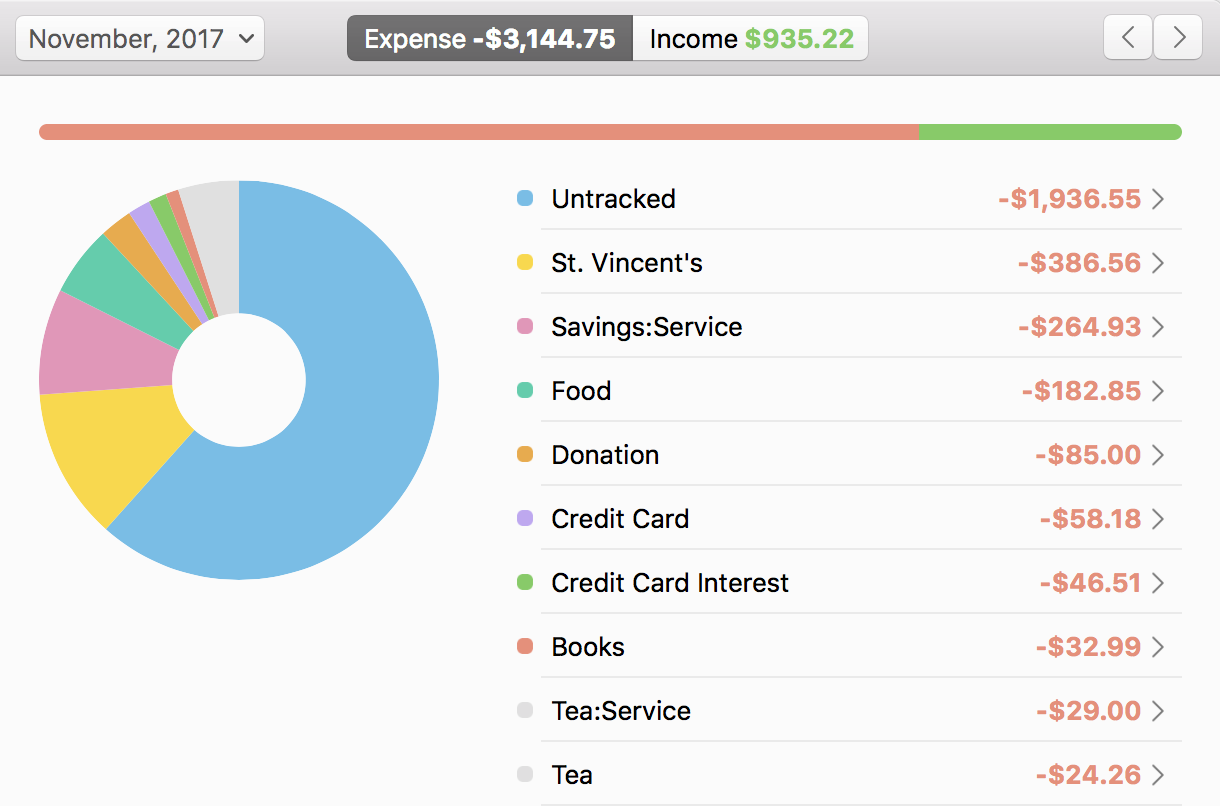
In Savings, the breakdown chart gives you such an overview.
Here is how breakdown looks on the Mac.
Here is how it looks on the iPhone.
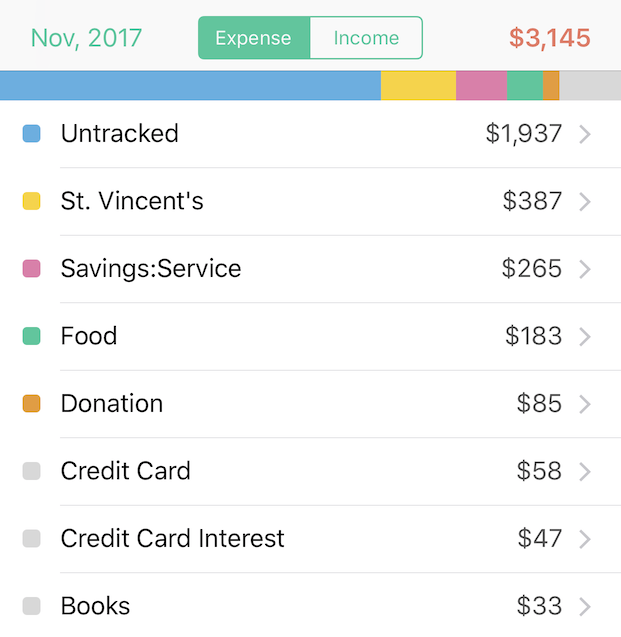
They both work the same way. You can tab between Expense and Income to see expense and income breakdown.
A category will appear only in either Expense or Income. What determines if a category appears as Expense or Income is the sum of transactions in that category. If the amount is negative or zero, it appears under Expense.
The reason this works this way is so, let’s say you spent $100 in the Electronics category this month but returned $40 of it in the same period, the Electronics category will show up as $60 ($100 - $40) in the Expense category – just what you would expect to see.
Drilling in
If you are not sure why a category’s sum is so large, you can click or tap it to see the transactions that make up that amount.
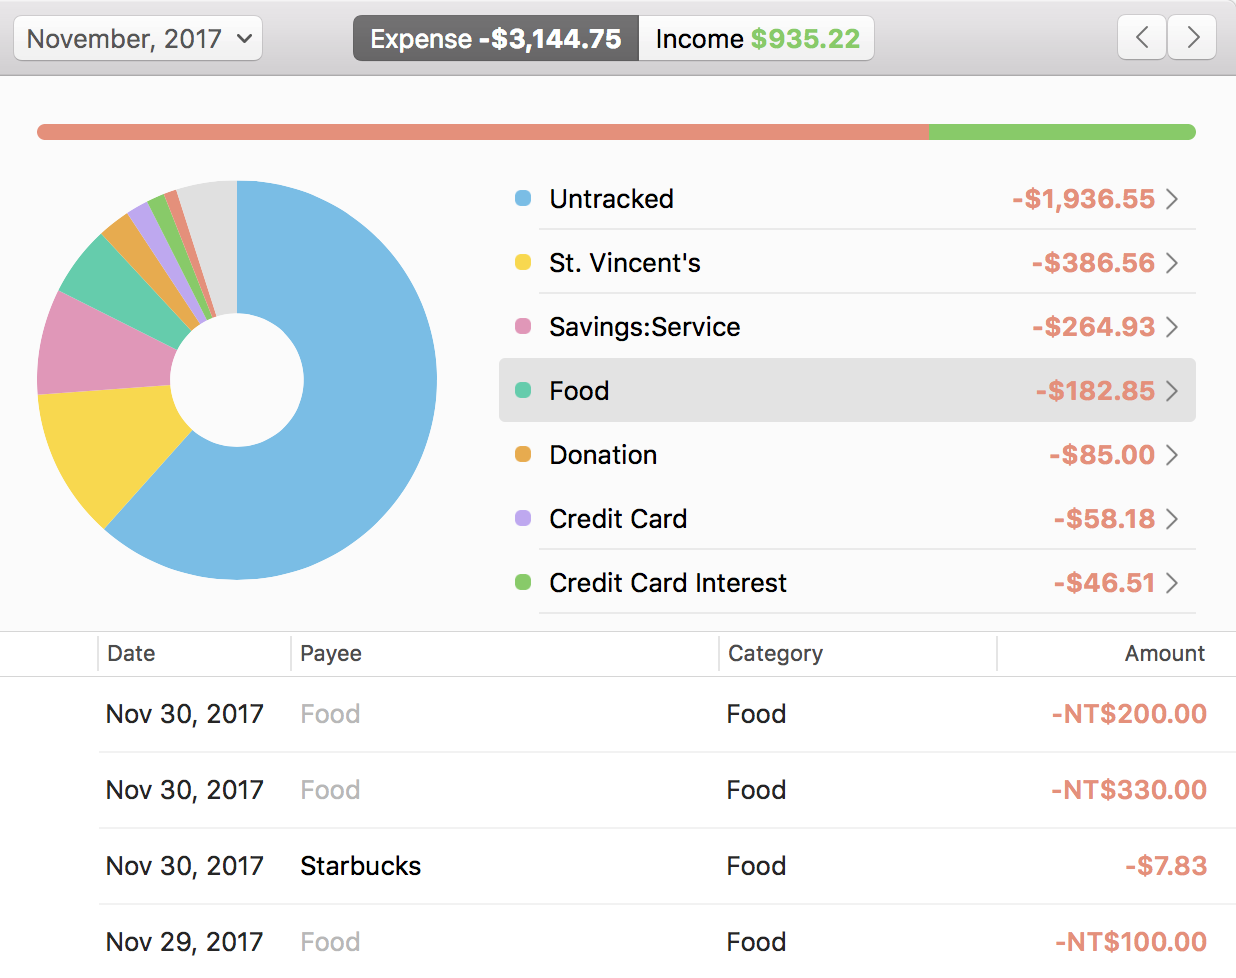
Here, you are seeing all the transactions under “Food”.
Changing period
To select a different time span, just click the period button.
On the Mac, you can navigate forward and backward within a time span with the left and right arrow button. On the iPhone, you can do the same by swiping right and left in the view.